
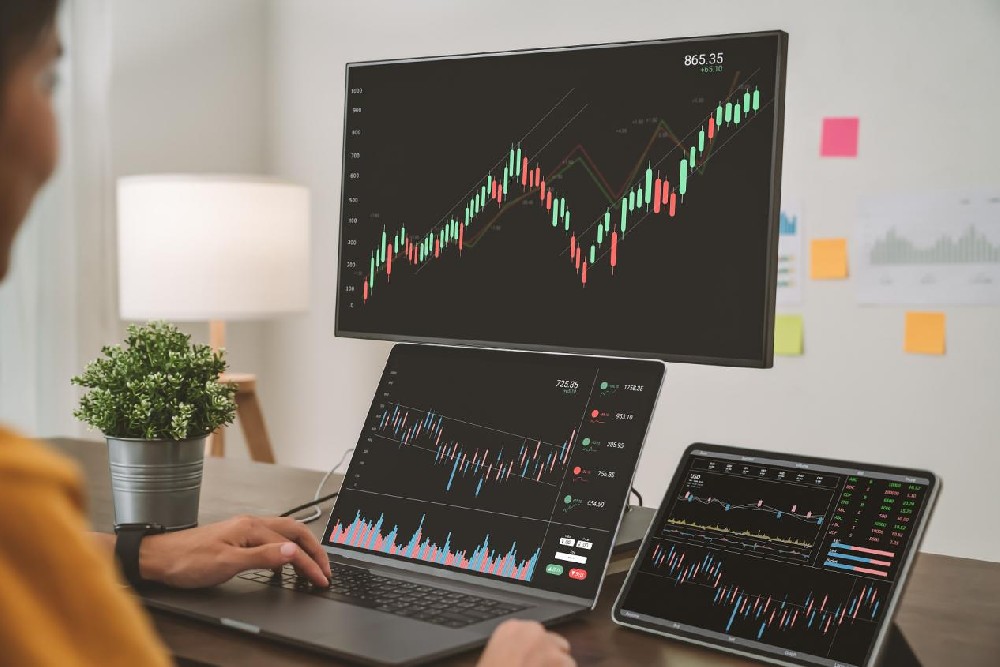
For rational traders who are obsessed with technical analysis, a trading log is never just a simple record book, but a key to deciphering the market's secrets. Many traders are engrossed in finding the "holy grail indicator," neglecting the value of their own operational data—those impulsive orders, last-minute stop-loss adjustments, and impulsive closings often hold the truth behind profits. ACE Markets understands this well, upgrading its trading log from "manual recording" to "automatic data accumulation." Every opening, closing, and adjustment of stop-loss and take-profit levels is captured in real time and stored in a structured format. Here, there is no vague "feeling," only millisecond-precise timestamps, standardized price levels, and quantified position data, allowing traders to break free from the limitations of "reviewing from memory" and use real data to reconstruct the entire trading picture.
The pain point of traditional trading logs is that "recording is easy, but analysis is difficult," while ACE Markets' advanced backtesting tools directly create a closed loop of "recording-analysis-optimization." When you complete a trade on the platform, the system automatically generates structured tags containing entry reasons, market conditions, and sentiment fluctuations, which can be directly integrated into the analysis module without manual organization. More importantly, this data is not just a cold accumulation of numbers, but is deeply linked to your strategy logic—for example, you can compare the performance difference between "entering when the price breaks through the 20-day moving average" and "entering when the price pulls back to the support level," or verify whether "holding for more than 2 hours" really improves the win rate. For rational traders, this two-way verification of "strategy-data" is far more valuable than blindly trying and failing, making each backtesting a precise anchor point for strategy iteration.
From fragmented records to visual insights: How ACE decodes trading DNA
Profit/loss ratio, win rate curve, and holding time distribution—analytical dimensions considered core secrets by professional institutions—are now readily accessible through ACE Markets' visualization tools. In traditional backtesting, you need to manually calculate the "total profits/total losses" to obtain the profit/loss ratio. On the ACE platform, the system automatically generates a dynamic curve based on your historical trades: the horizontal axis represents the time period, and the vertical axis represents the profit/loss ratio. You can clearly see whether your profit/loss ratio decreases in volatile markets and whether it remains stable within a reasonable range in trending markets. The win rate curve further breaks down the changing patterns of the "percentage of profitable trades," helping you identify "strategy failure warnings"—when the win rate falls below a threshold for two consecutive weeks, the system will prompt you to check the market environment or parameter settings, rather than letting you continue to stubbornly hold on in confusion.
A histogram of holding time distribution acts like a "truth mirror," exposing the hidden traps of rational traders. Many technical traders who pride themselves on "trend following" find that 80% of their trades are held for less than 30 minutes—this is hardly trend trading; it's clearly short-term speculation disguised as technical analysis. ACE Markets visually presents this contradiction, forcing you to confront the truth of "knowing but doing." A more advanced feature is cross-analysis: for example, overlaying trades with a "profit/loss ratio > 2" with "holding time > 4 hours" reveals that your profitable trades often occur within specific timeframes; correlating "stop-loss orders placed below support levels" with "win rate" verifies the effectiveness of your risk management logic. This multi-dimensional data perspective allows trading to return from "art" to "science."
More Than Just Tools: How ACE Markets is Reshaping the Evolution of Trading
Experienced traders understand that "opening a position" is merely the beginning of trading; "evolution" is the core of sustained profitability. ACE Markets positions itself not simply as a "trading platform," but as a "quantitative coach" accompanying traders on their journey of growth. While most platforms are still competing on spreads and leverage, ACE has already built a three-tiered system of "tools-data-growth": Beginner traders can quickly get started using pre-set backtesting templates, intermediate traders can customize analysis dimensions (such as splitting data by currency pair, time period, and strategy type), and advanced traders can even export raw data for further development. This layered design allows traders at every stage to find an evolutionary pace that suits them, preventing them from being deterred by complex features.
The shift from emotional trading to quantitative rationality essentially involves establishing a scientific cycle of "hypothesis-verification-optimization." ACE Markets' advanced backtesting tools act as a catalyst for this cycle: when you discover that "entering with a golden cross of moving averages" has a 15% higher win rate during the European session than during other sessions, you'll naturally adjust your trading time; when you see that profitable trades executed with "moving stop-loss to cost" earn an average of 30 more pips, you'll optimize your risk management rules. This data-driven iteration is more reliable than any "master's call"—because data doesn't lie; it only tells you the truth. For rational traders, ACE Markets offers not only a trading "arsenal" but also a "ladder" to becoming a mature trader, bringing every click one step closer to consistent profitability.


